These are my living personal study notes. Use them at your own risk!
Notes
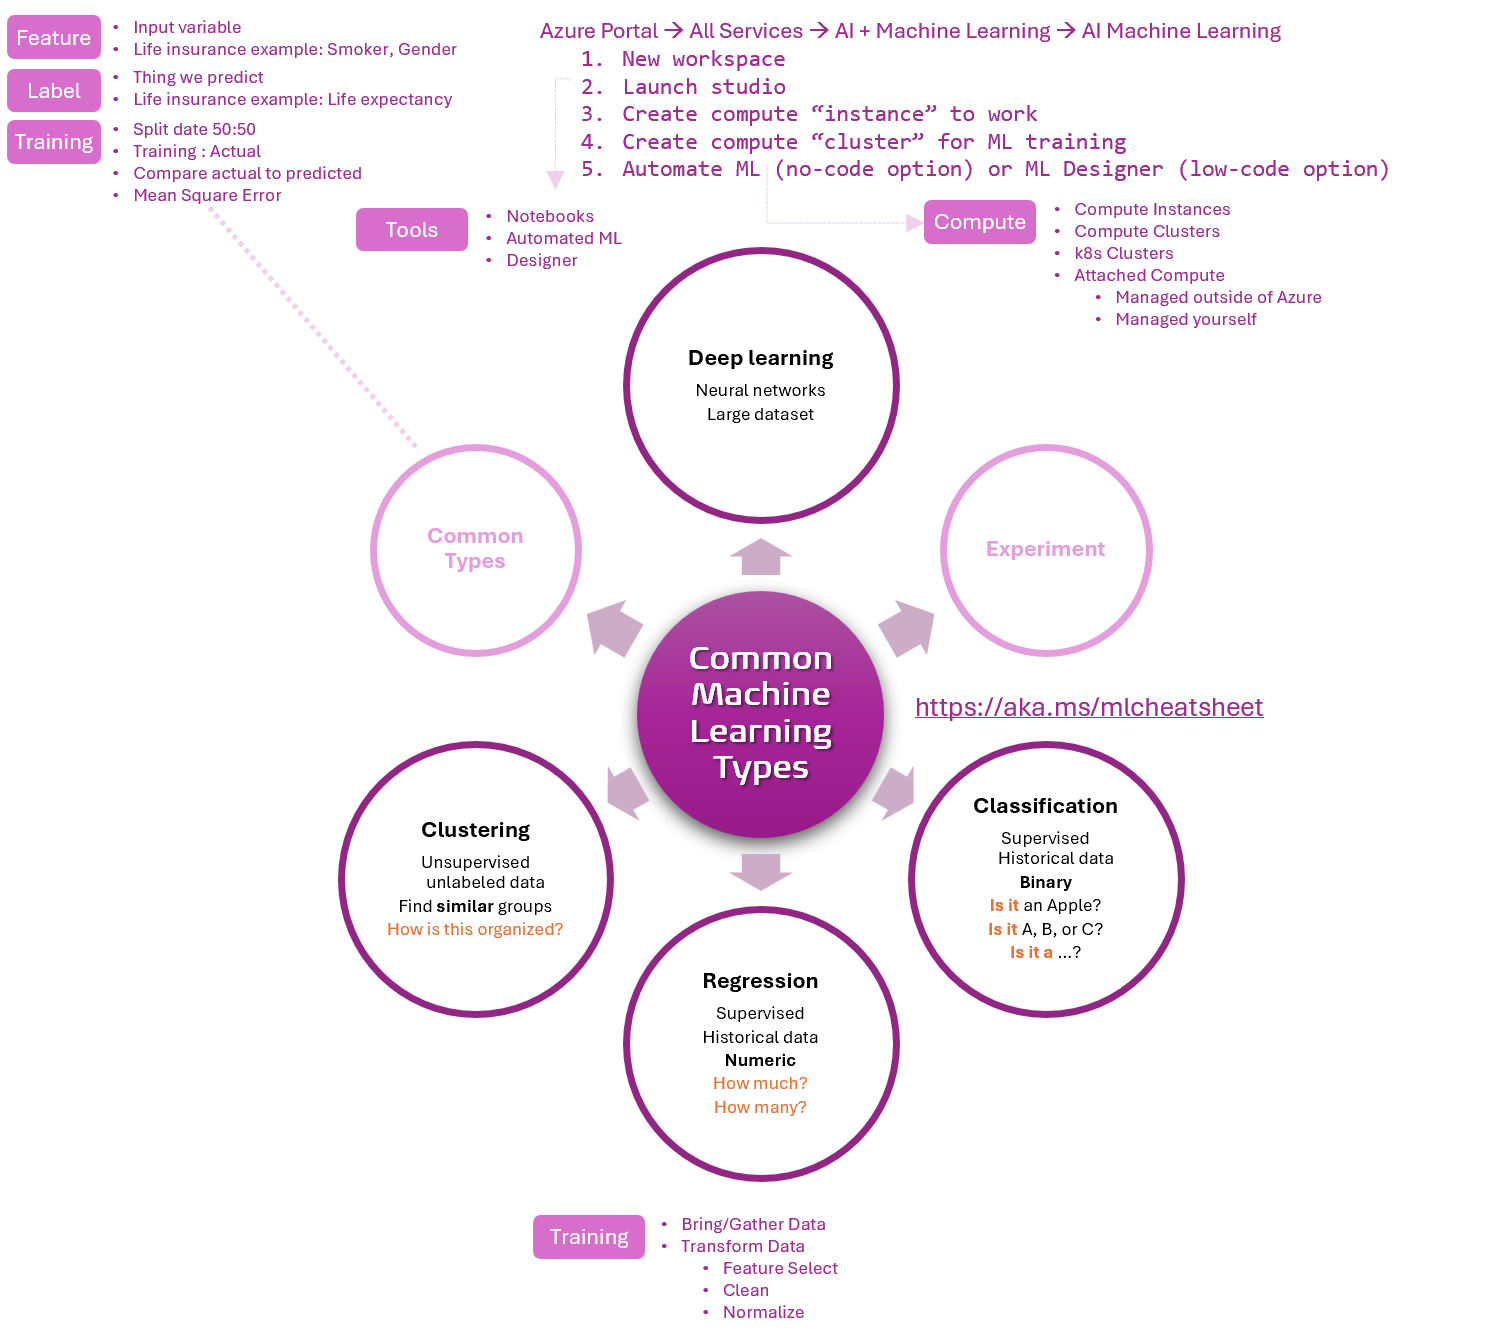
- Classification predicts categories of data, such as sentiment if users on the X platform.
- Clustering algorithm automatically finds the optimal way to split a data set into groups without training.
- Feature engineering is the method of creating new features, based on existing features.
- Feature selection allows us to narrow down the features that are important for label predictions.
- Training a Regression model involves data gathering and transformation: Feature selection --> Finding and Cleaning outliers --> Impute missing values --> Normalization or Feature engineering.
Metrics
Confusion Matrix Terms
- True Positive (TP) - number of positive cases predicted correctly.
- True Negative (TN) - number of negative cases predicted correctly.
- False Positive (FP) - number of positive cases predicted incorrectly - Type 1 error.
- False Negative (FN) - number of negative cases predicted incorrectly - Type 2 error.
Classification model
- Accuracy - the ratio of predictions that exactly match the true class labels. Closer to 1 the better. Range: [0, 1]. Metric = (TP+TN)/(TP+FP+TN+FN).
- Area Under Curve (AUC) reflects the model's performance - AUC=1 is best fitted model and AUC<0.5 is worse than random. Range: [0, 1].
- AveragePrecision (AP) is the combined metrics of both Precision and Recall, used in vision model.
- Confusion matrix provides a tabulated view of predicted abd actual values.
- F1 Score - machine learning evaluation metric that combines precision and recall scores. Metric = (2PrecisionRecall)/(Precision+Recall).
- Precision - the ability of a model to avoid labeling negative samples as positive. Closer to 1 the better. Range: [0, 1]. Metric = TP/(TP+FP).
- Recall - the ability of a model to detect all positive samples. Closer to 1 the better. Range: [0, 1]. TP/(TP+FN), where TP=true positive, FN=False negative.
- Selectivity - measures the ability of the model to correctly identify negative samples (i.e., true negatives) out of all the actual negative samples. Metric = TN/(TN+FP).
- Specificity - the ability of a model to correctly identify negative instances. TN/(TN+FP)
- Weighted accuracy is accuracy where each sample is weighted by the total number of samples belonging to the same class. Closer to 1 the better. Range: [0, 1].
Regression Model
- Coefficient of determination, often referred to as R2, represents the predictive power of the model. Closer to 1 the better. Range: [0, 1].
- Mean absolute error (MAE) measures how close the predictions are to the actual outcomes. A lower score is better.
- Root mean squared error (RMSE) creates a single value that summarizes the error in the model. By squaring the difference, the metric disregards the difference between over-prediction and under-prediction.
- Relative absolute error (RAE) is the relative absolute difference between expected and actual values. The mean difference is divided by the arithmetic mean.
- Relative squared error (RSE) similarly normalizes the total squared error of the predicted values by dividing by the total squared error of the actual values.
Clustering Model
- Average Distance to Other Center represent how close, on average, each point in the cluster is to the centroids of all other clusters.
- Average Distance to Cluster Center represent the closeness of all points in a cluster to the centroid of that cluster.
- Combined Evaluation score at the bottom of each section of results lists the averaged scores for the clusters created in that particular model.
- Maximal Distance to Cluster Center represent the max of the distances between each point and the centroid of that point's cluster. High = dispersed.
- Number of Points shows how many data points were assigned to each cluster, along with the total overall number of data points in any cluster.
Example
You need to examine historical data to forecast price ranges for your product. Label = prediction = price range.
- The classification model is
suitablefor supervised learning to determineis ita low, medium, high, or very high price. - The regression model is
inappropriatebecause it forecasts numerical values rather than determining whether something belongs to the "is it" class. - The clustering model is
inappropriatebecause it clusters unlabeled data into similar groups.
You perused:
Enjoy other learning notes:
AI-900 Quick reference Poster: